Hi Folks,
See the Youtube version of this blog here:
The Tableau Iron Viz season is upon us again. Just recently the Iron Viz Europe shortlist contest concluded with a theme of ‘European Cities’ It saw some very nice entries and congratulations the Top 3 who will be competing live on Stage in July for the Iron Viz Europe 2018 title. I was keen on cooking up an entry; found a potential datasource on European Airport traffic data, and had even done some initial data prep, when I spotted the terms of entry – you had to reside in Europe.
Bummer! 😦
I thought about entering with my Country as Austria, and seeing if could get away with it – but Alas didn’t think I had much of a chance.

Anyway, when I saw the entries published up a couple of weeks later, I got inspired to go back and continue where I left off and get something good enough to at least publish up to tableau public. I was further inspired by a great blog post from Ian Baldwin from The Information Lab on how to do a Sankey chart in Tableau without having to duplicate the dataset – and I was looking to give a go.
The dataset I had found was from Eurostat – and was in pretty raw text with separators form. There was a number of ingredients to work with in the file; including measures of flights and passenger numbers for all airports in Europe, and timeseries data at the partner country grain. There were measure codes, country and airport codes that I needed to track down reference data.
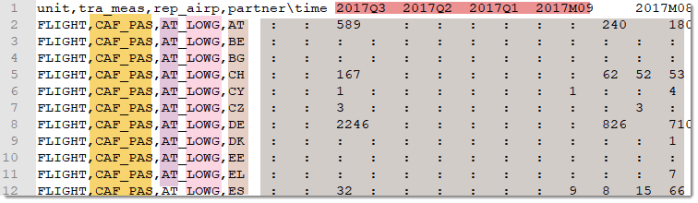
I needed to do quite a lot of parsing, and joining to reference data – so I fired up my go-to data prep tool – Alteryx – where I was able to pretty quickly get something out into Tableau to have a look at.
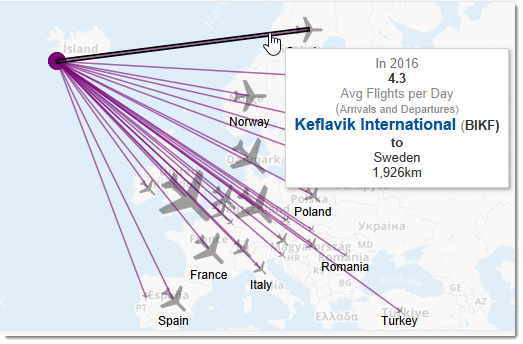
For starters, I tried out airports, and partner countries on a dual axis Map. This was looking good, so i went and added some spatial stuff in the Alteryx workflow to obtain some cardinal directions and km distances, as well as turn my airport and country lat/longs into spatial objects, – which I pushed out into SHP files to add to my datasource.
I seasoned it with a trendy viz in tooltip, and it was almost ready for eating!

I then got a half-baked idea that I would like to have an action filter to display some flight path lines between airports and partner countries. I tried a polygon solution with paths which didn’t seem to want to work with my Geometry lat/long points, so I went back to the flow to create another Shape file which contained one polyline object per airport / partner country combination.
I also had a lot of fun creating custom airplane shapes that lined up with the cardinality – which I had first seen done by Cheeky Chappy back in his EasyJet days.
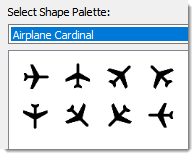
I added it as a pop-up view in a vertical container, and it was like adding some special tasty sauce to my viz for sure!
As for the Sankey chart, it was a breeze to copy and paste the calculations from Ian’s blog/recipe into my workbook, and even though I messed up one of the nested table calculation ‘compute using’ orders, I had a parameter driven Sanky in no time.

For dessert, I added a good old line chart so users could explore trends over time, using my plane shapes to express up down or same indicators:

Special thanks to Andy Kriebel @VizWiz who helped out with a peer review and gave me some tips on colours and viz in tooltips.
Here is a link to the viz on tableau public – so go ahead and tuck in for a tasty feast
If you want to see a bit more of the behind the scenes details on how the data and the viz’s came together checkout my CraigsHack for Tableau youtube clip.

Thanks for reading and Bon Apetite.
Until next time…….


