This week is week 13 of #DSAU1, the first cohort of The Data School Australia. In the tradition of The Data School UK, The data schoolers will be given a data and dashboard challenge every day for 5 days in a row. Readers of my blog will know that I am quite the fan of Horse Racing metrics, so it will come as no surprise that the dataset for the first Monday in November was all about THE MELBOURNE CUP.
I gave the team some raw data via a webscrape of racenet.com.au, plus some history stats of winners since 1983. They had to use Alteryx to do quite a lot of parsing in order to get the data into a Tableau friendly format. It was great to wake up on the morning of the big race and see a whole bunch of blogs linking to a whole lot of great dashboards.
- https://www.thedataschool.com.au/jonathon-cavalieri/dashboard-week-day-1-melbourne-cup/
- https://www.thedataschool.com.au/jasna-dishlieska-mitova/dashboard-week-day-1-melbourne-cup-2018/
- https://www.thedataschool.com.au/meera-vijayan/dashboard-week-day-1-melbourne-cup-2018-2/
- https://www.thedataschool.com.au/mohammed-hemayed/dashboard-week-1-5-melbourne-cup-regex-party/
- https://www.thedataschool.com.au/babita-dalal/beginning-of-dashboard-week-dsau1/
Fans of CraigsBet will also be happy that i’ve updated my Tableau Public viz to allow some informed punting decisions.
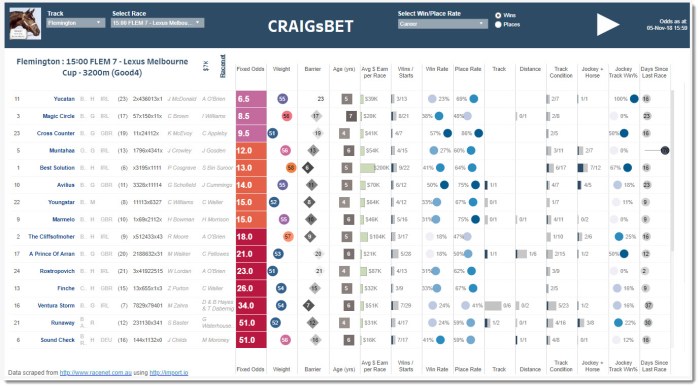
Link to Tableau Public Viz


